MTB telemetry for riders who send it

Every jump.
Every mph.
Every line.

Alyne turns your phone into a ride computer built for dirt. Jump airtime and landing G, top-speed bursts, Flow Score, climbs, descents, and segment leaderboards, captured automatically from the moment you drop in.

Live jump detection iOS available now Android in beta
Air time
0.00s
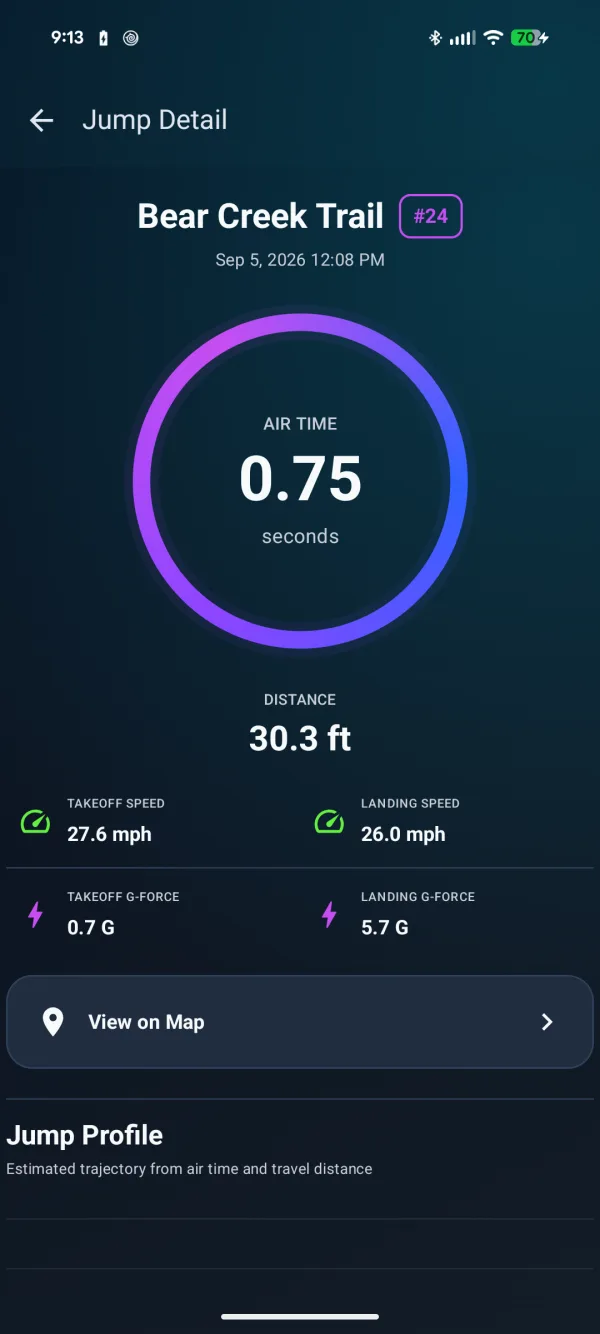
30.3 ft · 5.7 G landing
Top speed
0.0mph
0.74 mi high-speed streak
Peak G
0.0g
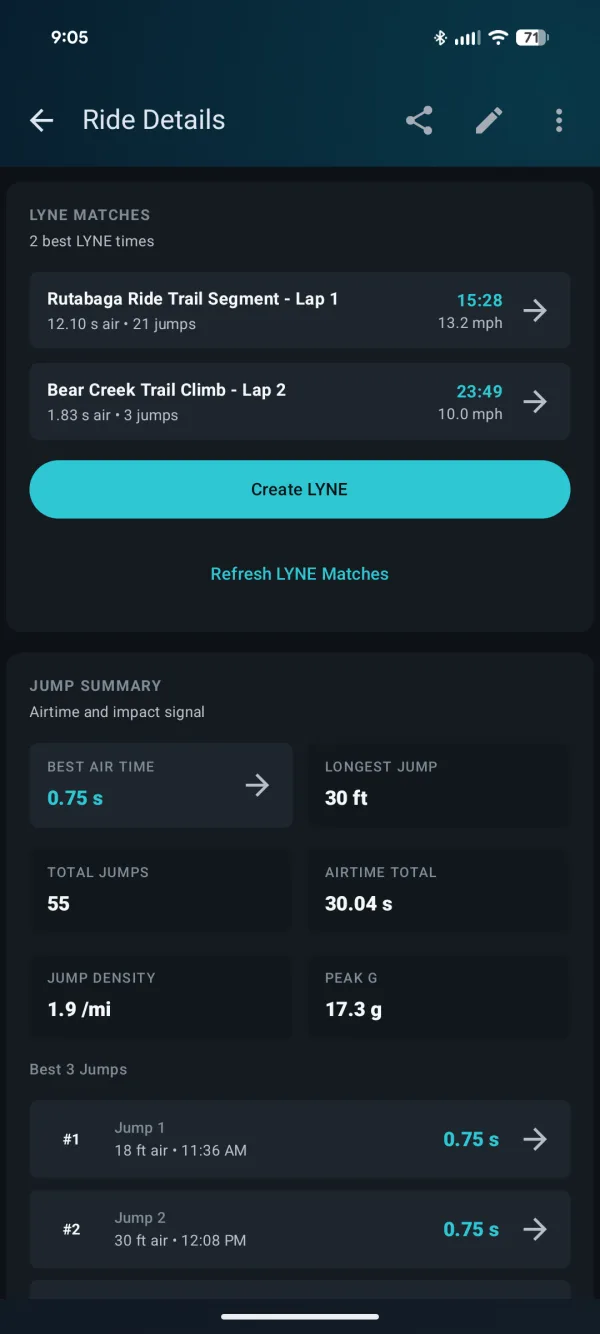
55 jumps this ride
Flow score
0/100
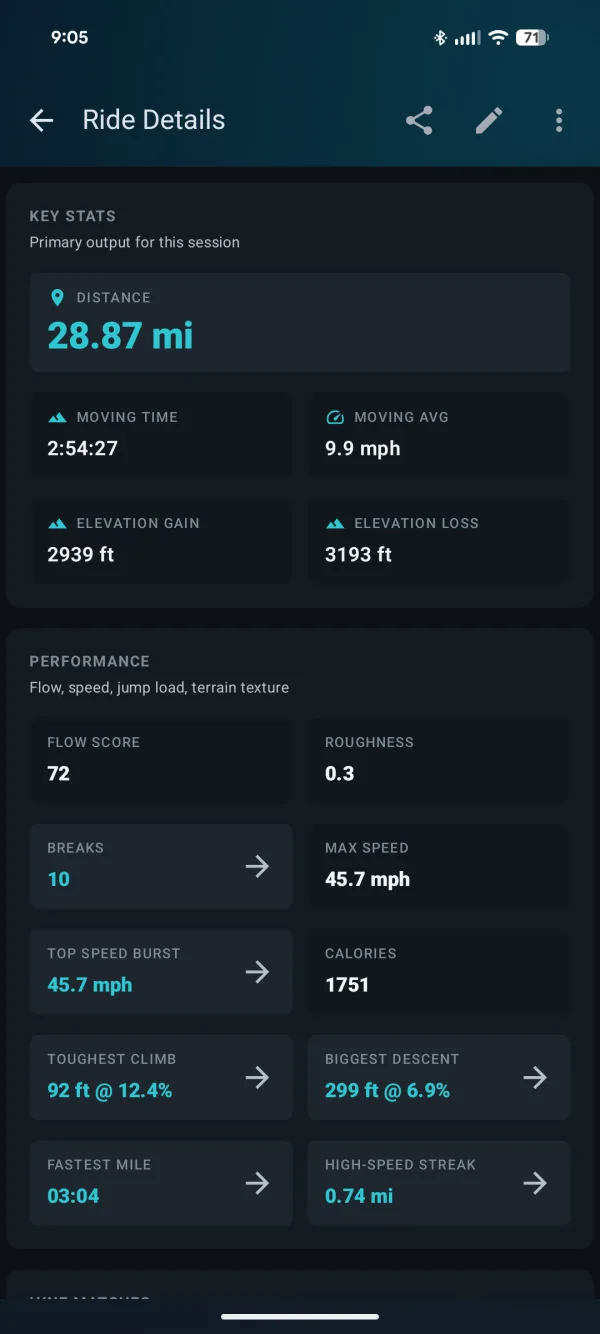
Roughness 0.3
Elevation
0ft gain
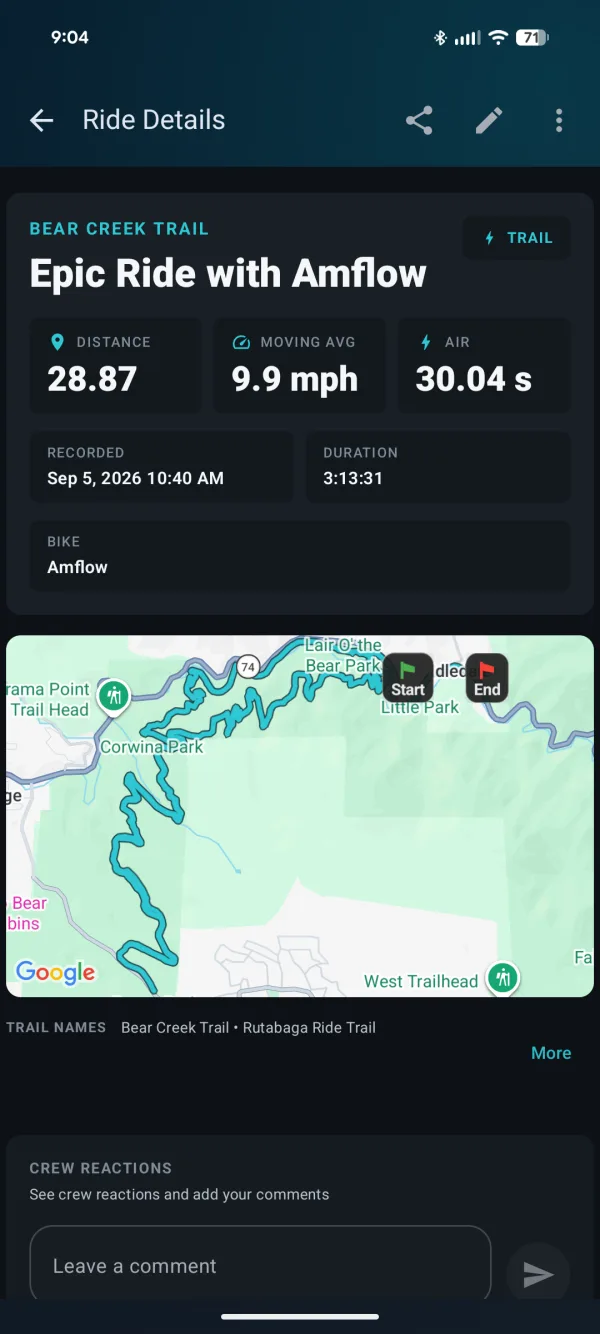
28.87 mi · 3:13:31
Scroll to drop in
Recording Sensor 100 Hz

Jump detection

Built around the jump.

Most trackers see a jump as a GPS blip. Alyne fuses accelerometer, gyro, barometer, and GPS at high rate to catch takeoff, flight, and impact on every hit, then beeps and buzzes so you know it counted.

  • Air time and distance

    Flight time to the hundredth of a second, with estimated travel distance and a trajectory profile.

  • Takeoff and landing G

    See how hard you hit. Peak G per landing, plus an impact signal trace from 280 ms before takeoff to touchdown.

  • Jump map and best three

    Every jump pinned on the trail. Scrub through landings, rank your best three, and share any single hit with the crew.

  • Live feedback, tuned by you

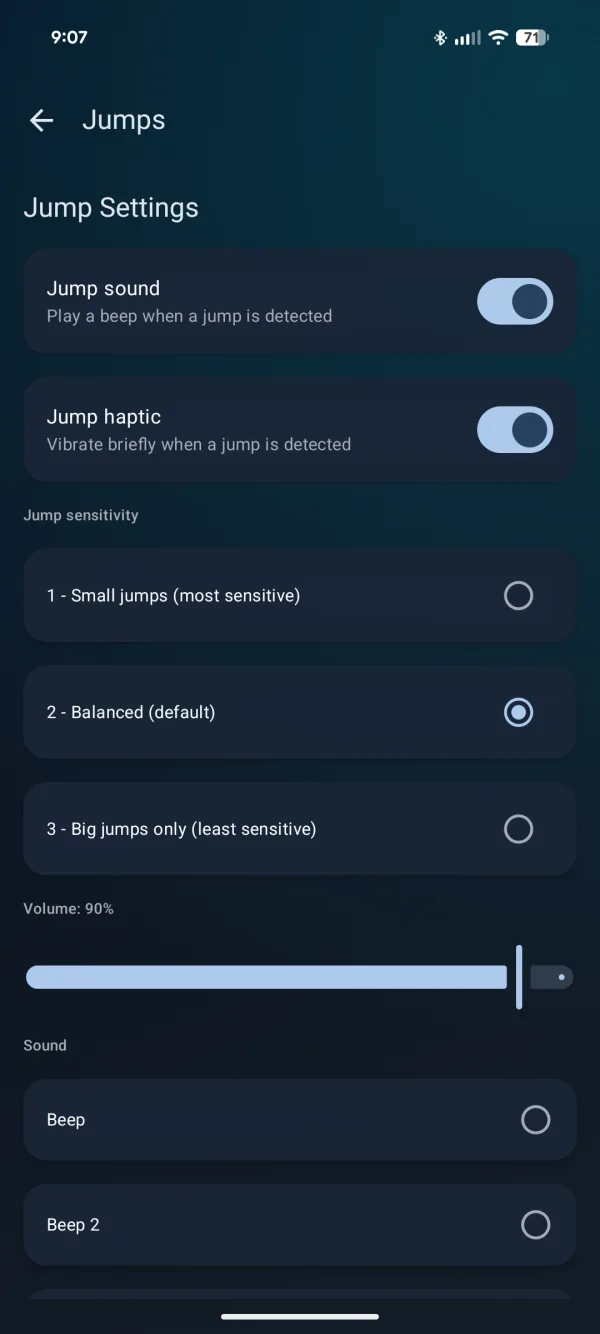
    Beep and haptic on detection, three sensitivity levels from small hits to big sends, and adjustable volume.

Air time
0.00
seconds
Distance32.4 ft
Takeoff speed21.2 mph
Landing speed18.5 mph
Landing G-force7.7 G

Jump profile

Estimated trajectory from air time and travel distance.

Impact signal-281 ms → landing

Ride telemetry

Numbers that describe how the trail actually rode.

Distance and moving time are table stakes. Alyne adds flow, roughness, speed bursts, climb grades, and descent stats so a 28-mile day has a real story.

Speed & movement analytics

Top speed bursts and high-speed streaks.

Every burst is timestamped and pinned to the map so you know exactly which straight, which lap, and which line got you there.

0
Flow score

Line smoothness and speed momentum combined into one number you can chase lap after lap.
Max speedGPS
0.0mph
Top speed burst
Fastest mileSplit
03:04
High-speed streak 0.74 mi
Toughest climbGrade
0ft
@ 12.4% average grade
Biggest descentDrop
0ft
@ 6.9% average grade
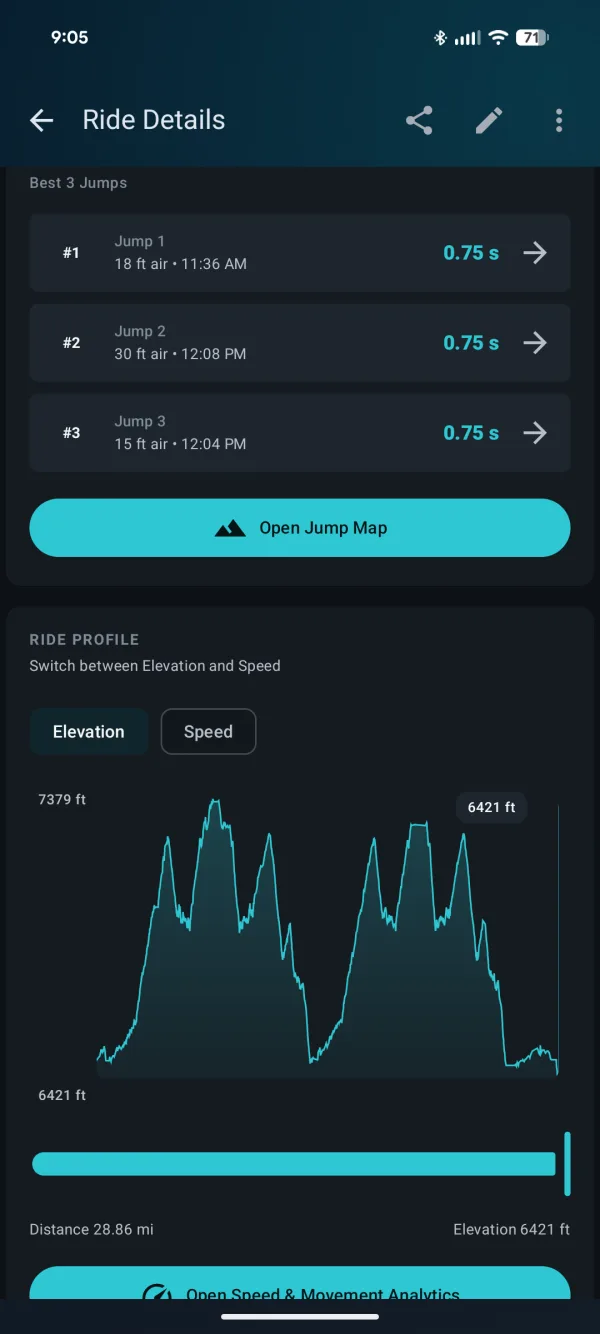
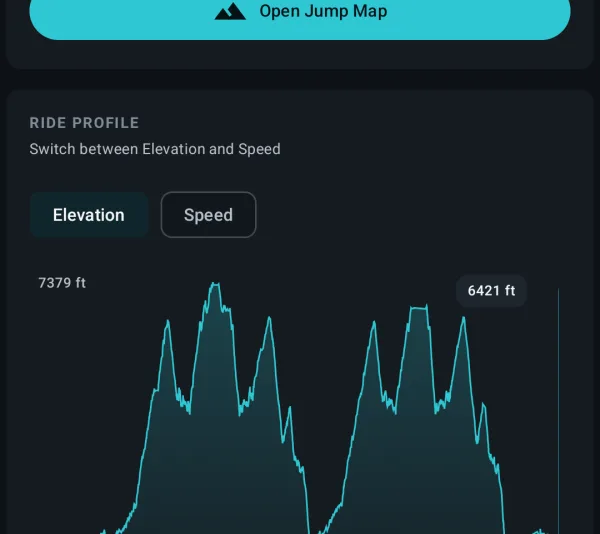
Alyne ride profile chart showing elevation between 6,421 and 7,379 feet across a 28.86-mile ride

Elevation and speed profile

Scrub the whole ride. Switch between elevation and speed, tap any point for the exact value.

RoughnessIMU
0.3
Terrain texture index
CaloriesEst.
0
3:13:31 on the bike, 10 breaks
Key statsPer ride
Distance28.87 mi
Moving avg9.9 mph
Moving time2:54:27
Elevation loss3,193 ft

See it move

One telemetry engine. Both platforms.

The same ride computer, the same jump math, native on iOS and Android.

iOS

Available now on the App Store. Ride details, jump map explorer, impact traces, and crew reactions.

Android Beta

Same engine, Material design. Get an early install link and help shape the Google Play launch.

LYNE segments

Draw a LYNE. Own the leaderboard.

A LYNE is a segment you define from any ride: a climb, a jump line, a full lap. Alyne matches every future ride against it automatically and ranks the fastest times by bike category, so eBikes race eBikes.

  1. Create a LYNE straight from a ride, or find nearby ones already drawn by the crew.
  2. Ride it again. Laps are matched and timed on their own, with air time and jump counts per lap.
  3. Chase the crown. Bike and eBike leaderboards, crew filters, and refresh-on-demand matching.

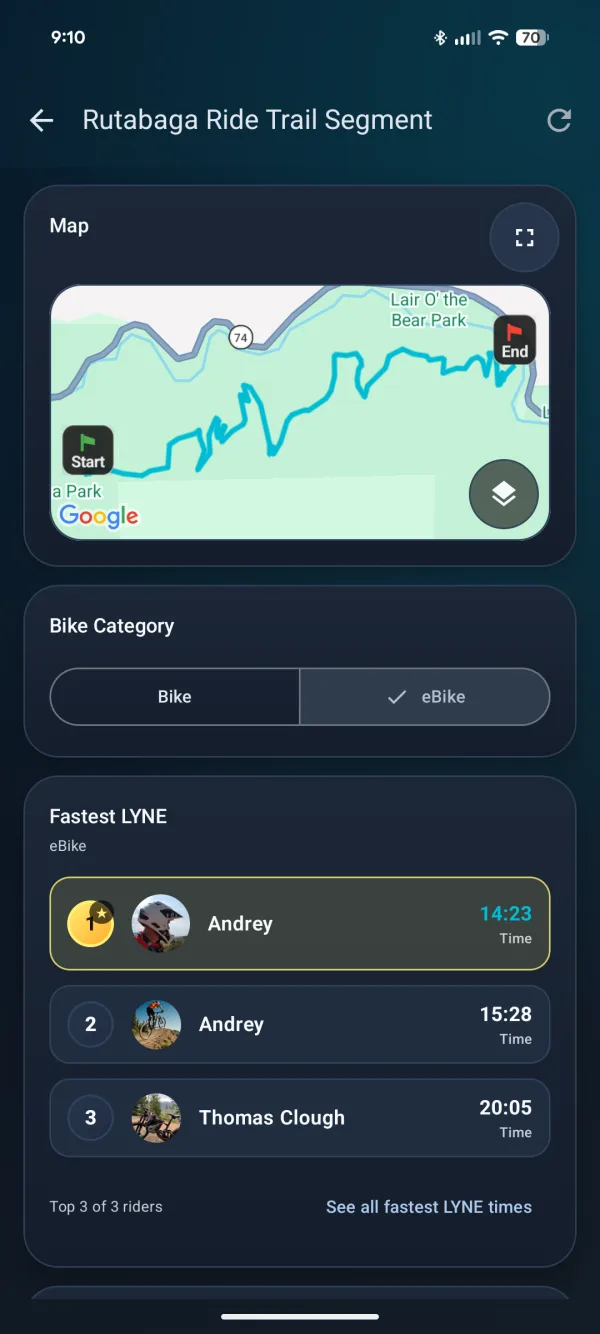
Rutabaga Ride Trail Segment

Fastest LYNE · Bear Creek, CO

1 YO You12.10 s air · 21 jumps 14:23Time
2 YO YouLap 1 · previous best 15:28Time
3 TC Crew riderTrail bike · 3 jumps 20:05Time
Top 3 of 3 riders See all fastest LYNE times →

Season insights

Your year, in one scroll.

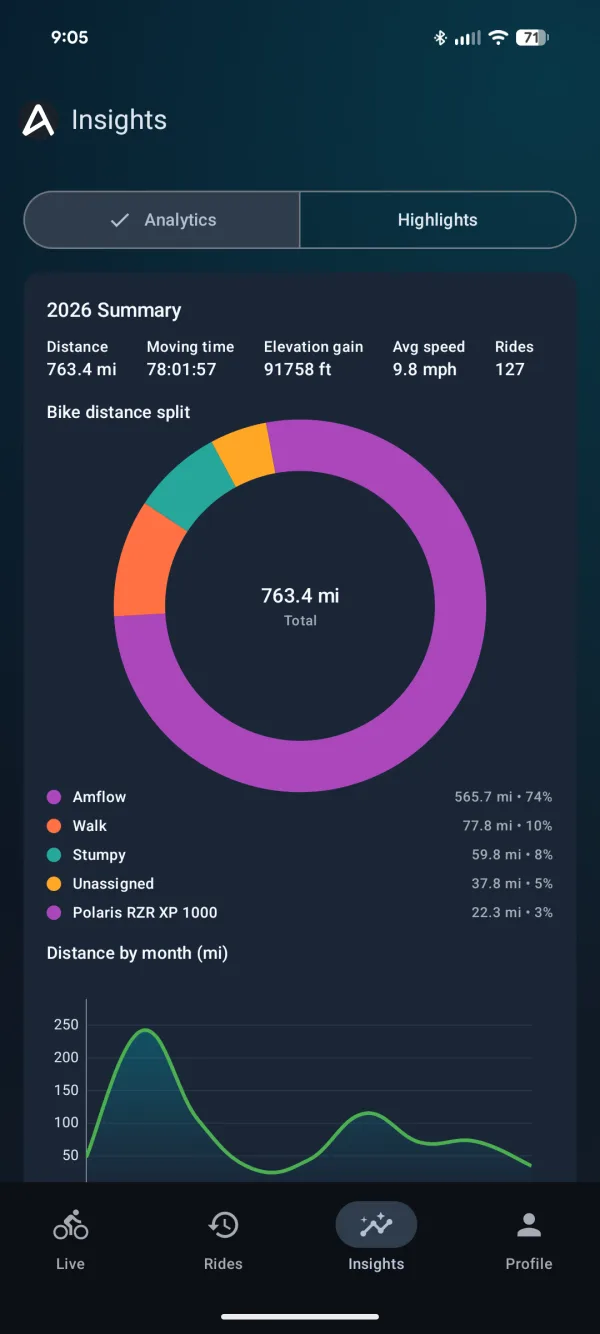
Totals, bike splits, monthly volume, and a highlight timeline that remembers your biggest air, most jumps, and first night ride.

2026 distance
0.0mi
Rides0
Moving time78:01:57
Elevation gain0 ft
Avg speed9.8 mph
Bike distance split
  • Amflow565.7 mi · 74%
  • Walk77.8 mi · 10%
  • Stumpy59.8 mi · 8%
  • Unassigned37.8 mi · 5%
  • Polaris RZR22.3 mi · 3%
Distance by monthmi
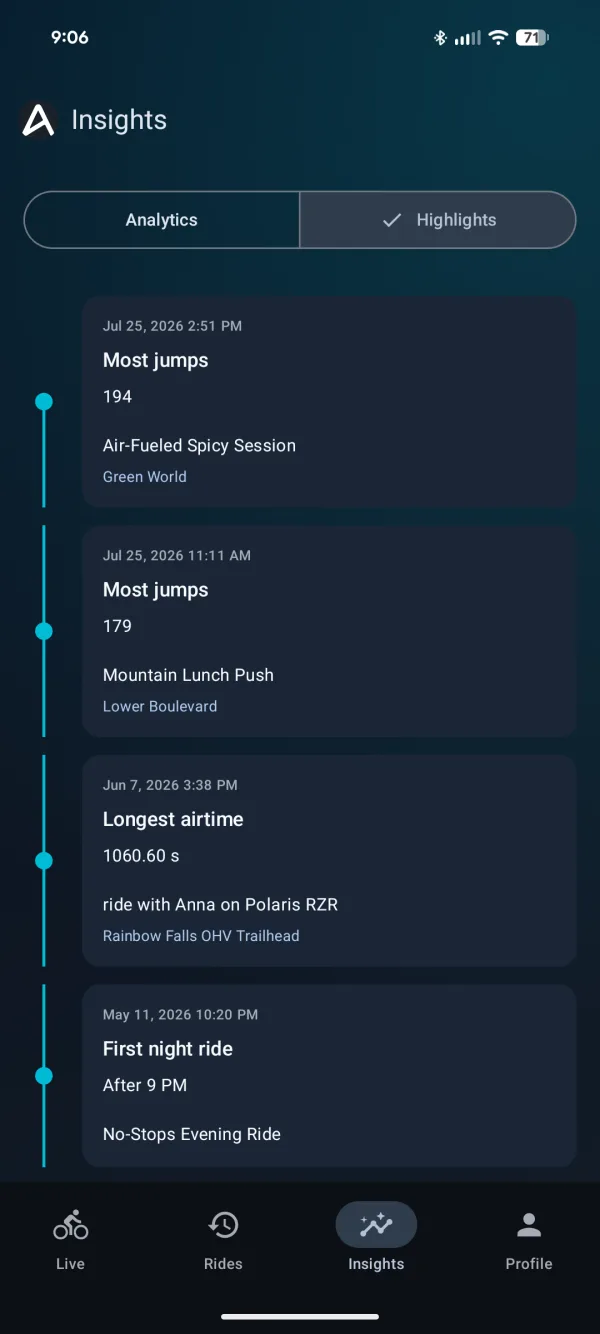
HighlightsAuto-detected
Most jumps 194 Air-Fueled Spicy Session
Most jumps 179 Mountain Lunch Push
Longest airtime 1.60 s Rainmaker Trail
First night ride 9 PM+ No-Stops Evening Ride

In the app

Every screen, built for the trailhead.

Ride details: Epic Ride with Amflow, 28.87 miles, 9.9 mph moving average, 30.04 seconds air, with route map
Ride detailsMap, trail names, bike, and headline stats.
Jump detail: 0.75 seconds air time, 30.3 feet, 27.6 mph takeoff, 5.7 G landing
Jump detailAir time ring, distance, speeds, and G-force.
Key stats and performance: Flow Score 72, roughness 0.3, max speed 45.7 mph, toughest climb, biggest descent
PerformanceFlow, roughness, bursts, climbs, and descents.
LYNE matches and jump summary: two best LYNE times, 55 jumps, 30.04 seconds airtime, 17.3 g peak
LYNE matchesLap times with air time and jump counts.
Rutabaga Ride Trail Segment leaderboard for eBikes with top three times
LeaderboardFastest LYNE by bike category.
Ride profile with elevation chart and best three jumps
Ride profileElevation and speed, scrubbable.
Insights: 2026 summary with 763.4 miles, 127 rides, and bike distance split donut chart
InsightsSeason totals and bike splits.
Highlights timeline: most jumps, longest airtime, first night ride
HighlightsAuto-detected milestones.
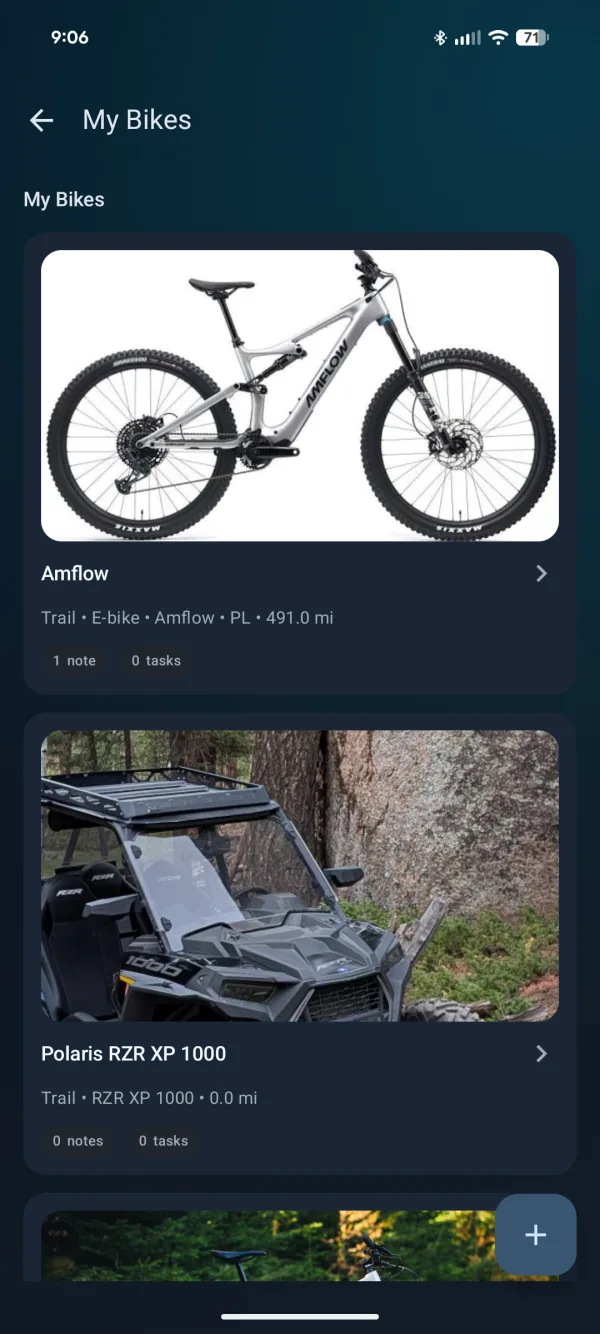
My Bikes garage with an Amflow e-bike and a Polaris RZR XP 1000
GarageEvery rig, with mileage, notes, and tasks.
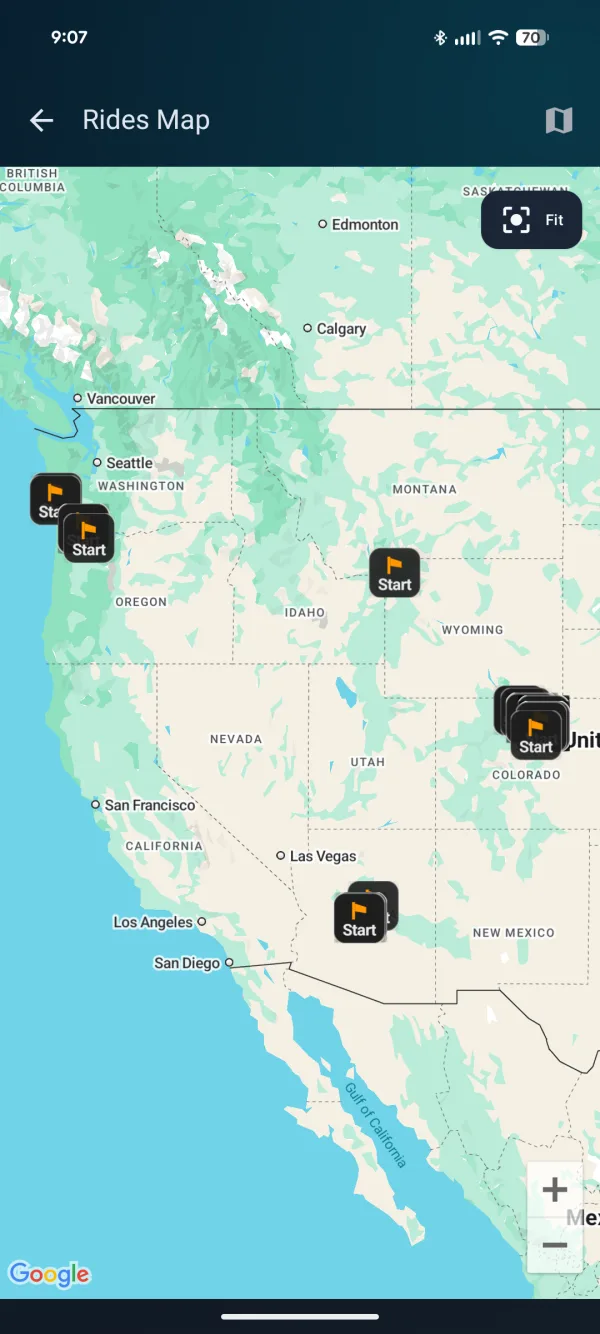
Rides map showing ride start markers across Washington, Idaho, Colorado, and Arizona
Rides mapEvery session, pinned across the West.
Jump settings: jump sound and haptic toggles, sensitivity levels, volume
Jump settingsSound, haptics, sensitivity, volume.

And the rest of the ride

Everything else a ride computer should do.

Bike garage

Trail bikes, e-bikes, even the RZR. Mileage per rig, notes, maintenance tasks, and ride history filtered by bike.

Live capture that stays readable

Auto-centering map, bold record state, and a dash overlay designed for sun glare and gloves.

Crew reactions

Comment on a ride or a single jump. See who you rode with, matched automatically by time and overlap.

Maps that show terrain

Satellite, topo, or dark modes with speed-colored polylines, direction arrows, and start and end flags.

Export and share

GPX, GeoJSON, and KML exports, share cards with stats and map snippets, and a Rider Portal on the web.

No ads. No data selling.

Recording is free forever. Your ride data is yours, and Pro only adds deeper insight when you want it.

Android beta

Help test Alyne before it lands on Google Play.

Drop your email and the Alyne team will send a private install link. Ride, send it, and tell us what the numbers got right and wrong.

  • Full jump detection, LYNE, and insights on Android
  • Direct line to the team for feedback
  • Early access to new features before public launch
Request accessAndroid

Pricing

Recording is free. Pro goes deeper.

Capture every ride at no cost, forever. Pro unlocks full jump history, season comparisons, LYNE trends, and export-ready data.

FreeLive capture, maps, unlimited history
$0
Pro monthlyCancel any time
$4.99/mo
Pro annualBest value, one full season
$29.99/yr